

Guide NaviBoss help
How to check piracy and security areas on your route
See which piracy, war-risk and reporting areas your route crosses, how many miles it runs inside each, and the latest security incidents worldwide.
The Piracy & security tool shows the security areas on the chart: the former High Risk Area, piracy hotspots, war-risk areas (JWC), warlike areas (ITF/IBF), voluntary reporting areas and transit corridors. With a route planned, it tells you which ones the route crosses and how far it runs inside each.
#Areas on your route
Plan a route first
Without a route the tool shows the areas worldwide. You can and plan one now.
Read the briefing
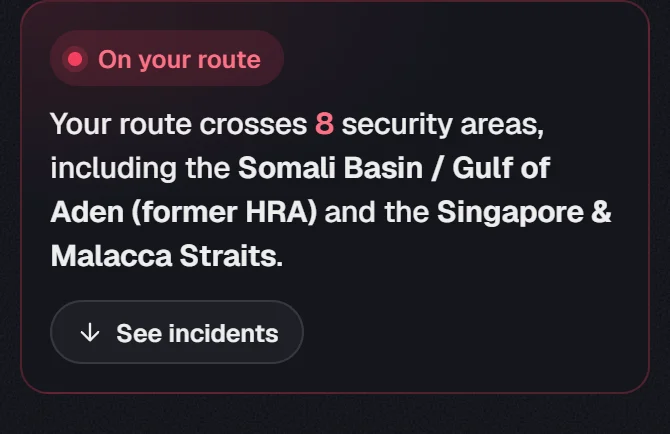
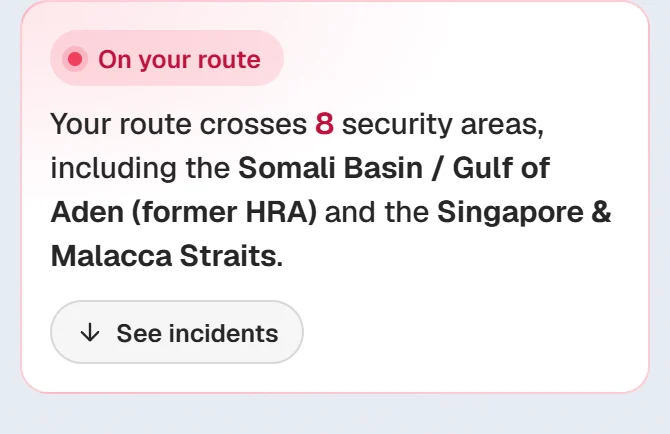
The card says how many security areas your route crosses and names the most serious ones.
Check the miles inside
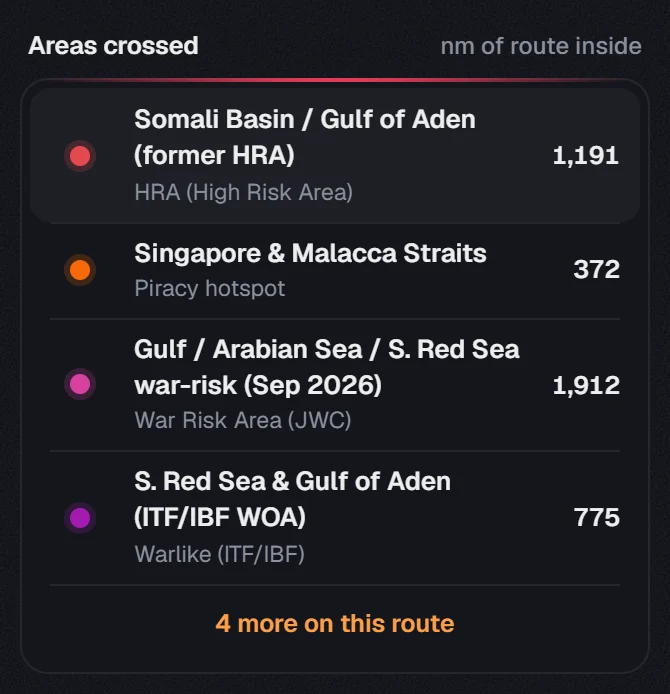
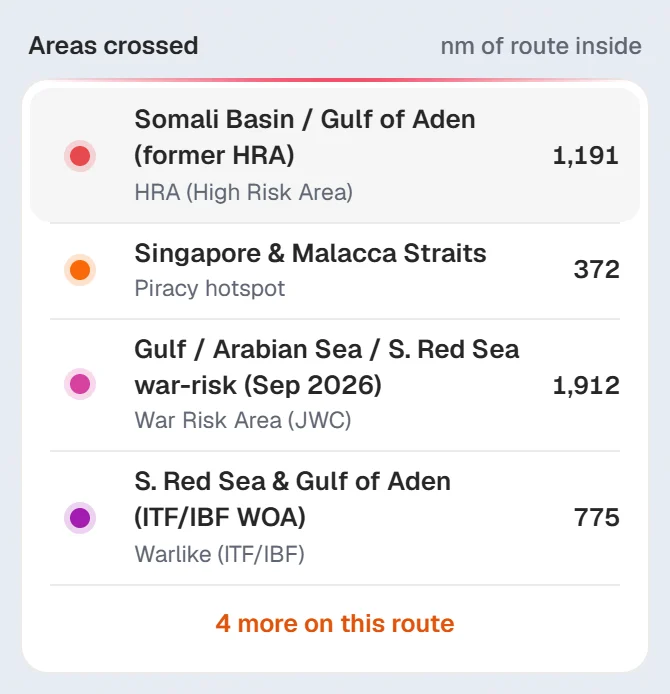
Under Areas crossed, each area shows its type and the nm of route inside. The most serious areas come first. If there are more, press the line under the list (4 more on this route) to see the rest.
#Route, In view and World
The three buttons at the top choose what the card answers for:
- Route: the areas your route crosses.
- In view: the areas on the part of the chart you are looking at.
- World: every area, grouped by type.
The same switch works in Warnings and Environment, so your choice follows you between them.
On a computer you can also click a spot on the chart. A pin marks it and the card answers for that spot. Click the pin and press Clear pin, or press Esc, to go back.
#Area types on the chart
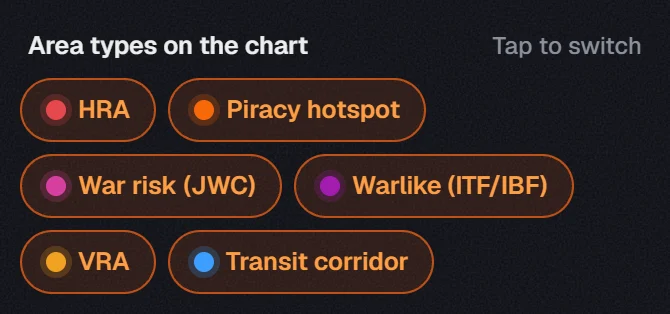
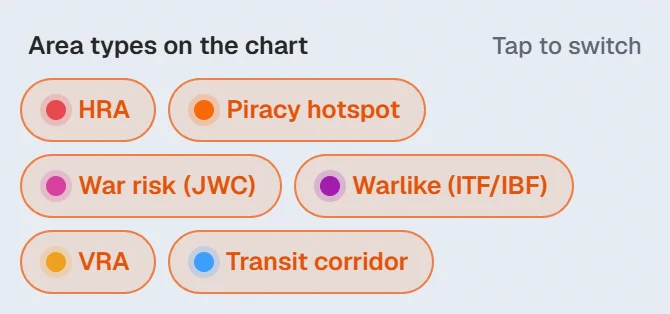
Under Area types on the chart, each button shows or hides one type: HRA, Piracy hotspot, War risk (JWC), Warlike (ITF/IBF), VRA and Transit corridor.
- The On chart switch at the top shows or hides everything from this tool.
- The pin beside it keeps the areas on the chart when you open another tool.
- Point at an area on the chart to see its name.
#Latest incidents
See incidents on the briefing card takes you down to Latest incidents. The list is worldwide, not only your route.
- The list shows four at first. Show all under it opens the full list with a search box (Search ship, place or type), the period (7 days, 30 days or 90 days) and All types.
- Click an incident to read the report. The chart moves to where it happened.
- The On chart switch beside Latest incidents puts each incident on the chart. Incidents close together share one marker: click it to zoom in.
#Export as user chart
Press Export as user chart above the list. Choose which area types go in, and the Incidents · 30 days button if you want the incidents too (it follows the period of the incidents list). Pick your ECDIS under For and press Download user chart.
Transit corridors are left out, as they are on the ENCs already. To put the security areas in one pack with your route file, see user charts in the Export guide.
About our guides
NaviBoss guides are written and checked by maritime industry experts, masters and deck officers. Each one is built from the same data the planner uses, dated, and rebuilt when that data changes. Spotted something wrong? Tell us on the feedback board.
A planning aid, not for navigation. Check official charts and publications, the latest notices and your company's instructions before you rely on any figure here.
Free Ready when you are
Try Piracy & security on your own voyage
Free account, no card. The same tool this guide shows.
Open Piracy & securityFree account · no card